DRAFT. This page contains placeholders that the publisher still has to fill in.
Methodology & sources
Every calculator on this site is a generic, educational model. This page explains the principles behind all of them; each calculator page lists its own formula, assumptions and sources.
Principles
- Transparent formulas. Each tool shows the formula it uses in plain English. No black boxes.
- Any currency, no conversion. The core tools work the same in every currency. You enter amounts in the currency you will spend in retirement; we never convert.
- Today’s money first. Inputs are in today’s money. Where a tool shows a future amount, it says so and shows the inflation rate used.
- Ranges, not promises. Results are estimates based on simplified assumptions and, where relevant, on historical data. Past returns do not guarantee future results.
- Not a forecast. Our calculators show what-if results for the assumptions you enter. They do not forecast or predict returns, inflation, or how long your money will last. Every calculator uses the same defaults: a 5% return a year before inflation and 2.5% inflation. These are the site’s example assumptions to adjust to your own situation, not predictions.
- Calculations run in your browser. Nothing you enter is sent to us or stored.
Research we rely on
Safe withdrawal rates (used in “How much do I need?”)
- Bengen, W. P. (1994). “Determining Withdrawal Rates Using Historical Data.” Journal of Financial Planning, October 1994, pp. 171–180. PDF (Financial Planning Association). Using US returns since 1926 for a 50% stocks / 50% intermediate-term Treasuries portfolio, a first-year withdrawal of 4%, raised with inflation afterwards, never exhausted the portfolio in less than 33 years (p. 173, discussion of Figure 1(b); checked against the original on 2026-10-17).
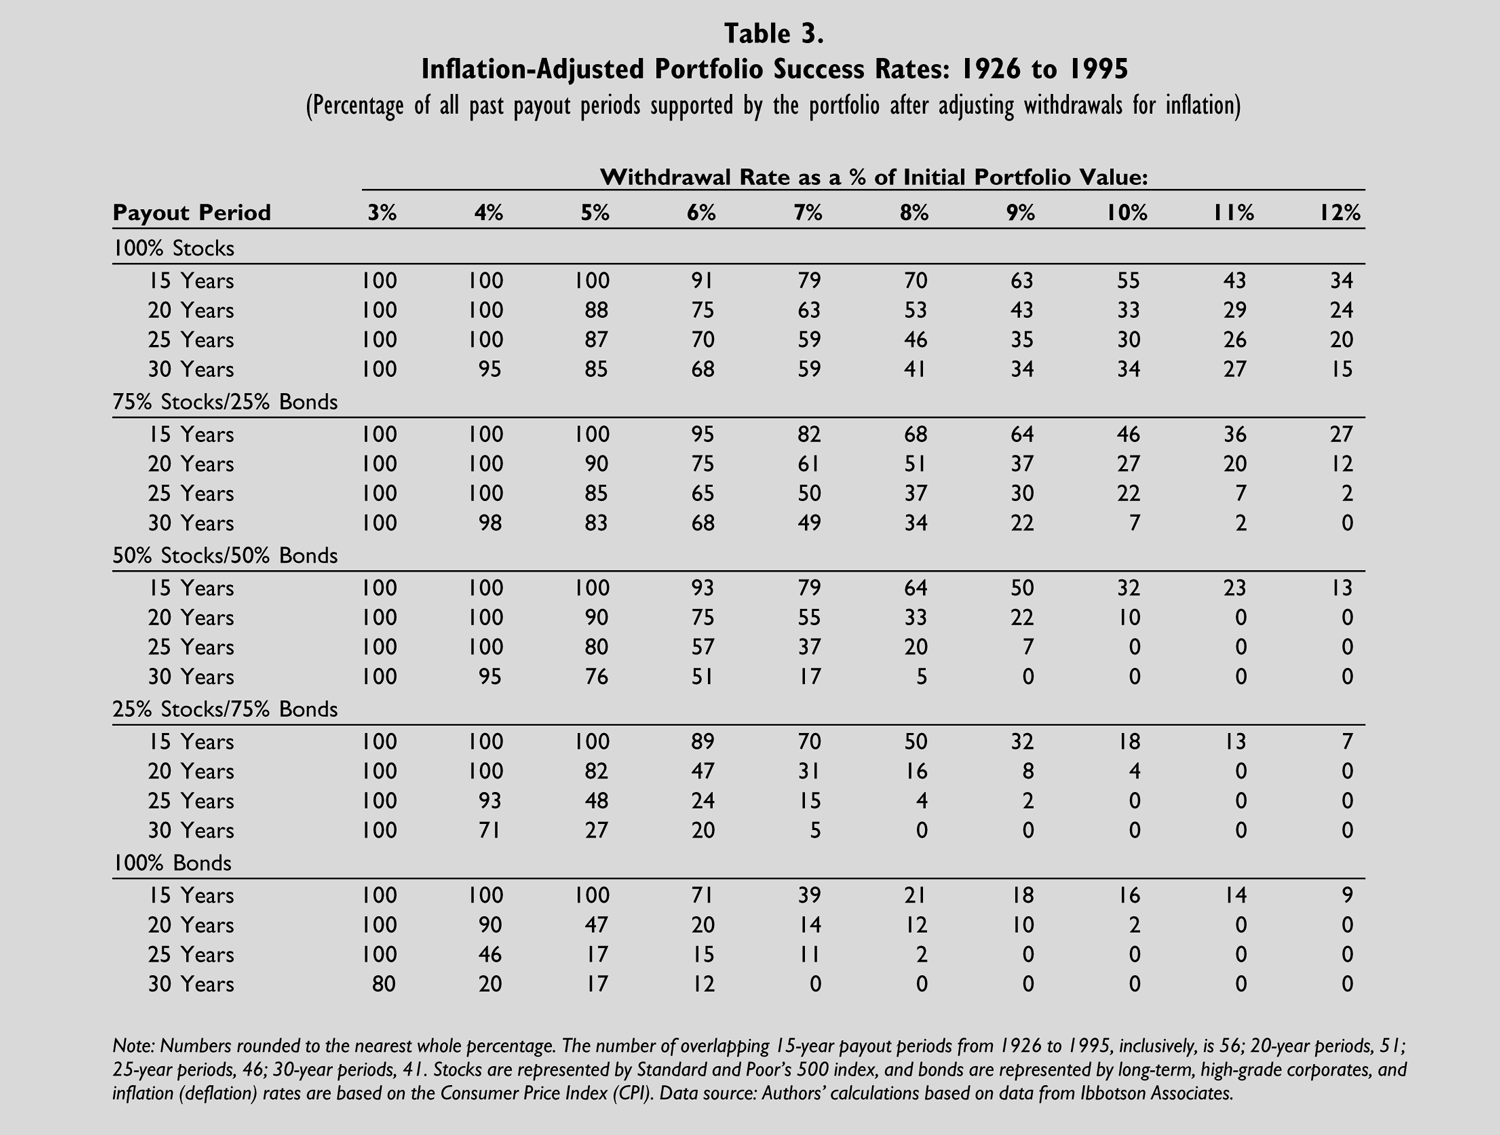
- Cooley, P. L., Hubbard, C. M. & Walz, D. T. (1998). “Retirement Savings: Choosing a Withdrawal Rate That Is Sustainable.” AAII Journal, February 1998, often called the “Trinity study”. Article · PDF. In its inflation-adjusted results (Table 3, 1926–1995), a 4% withdrawal from a 50/50 stock/bond portfolio lasted 30 years in 95% of the 41 overlapping 30-year periods; at 6% it was 51%. Stocks = S&P 500, bonds = long-term high-grade corporate bonds (checked against Table 3 on 2026-10-17).
Historical returns (reference figures in “How much do I need?” and “Withdrawal scenarios”)
- Damodaran, A. “Historical Returns on Stocks, Bonds and Bills: 1928–2025.” NYU Stern School of Business, data file histretSP.xls, updated January 2026. Overview · Data file. Yearly total returns of the S&P 500 (with dividends) and 10-year US Treasury bonds, and US CPI inflation. The compounded average of a 50% stocks / 50% bonds mix, rebalanced every year, was 7.8% a year before inflation over 1928–2025; US inflation averaged 3.0% a year over the same period. Over the same period, stocks returned 10.0% a year on average with typical yearly swings of ±19.4%, and bonds 4.5% with ±7.9%. We show these figures as a reference line with their source and period, never as a default; they are past US averages, not a forecast (downloaded and checked against the sheet’s own averages on 2026-10-22).
Withdrawal strategies (used in “Withdrawal scenarios”)
- Guyton, J. T. & Klinger, W. J. (2006). “Decision Rules and Maximum Initial Withdrawal Rates.” Journal of Financial Planning, March 2006. Article · PDF. Guardrail rules: skip the inflation raise after a losing year when the withdrawal rate is above the first-year rate; cut spending by 10% when the rate rises more than 20% above the first-year rate (not in the last 15 years); raise it by 10% when it falls more than 20% below. Our version is simplified (checked against the PDF on 2026-10-22).
- Jaconetti, C. M., Kinniry, F. M. & DiJoseph, M. A. (2014). “A More Dynamic Approach to Retirement Spending.” AAII Journal, April 2014. Article. Dynamic spending: a percentage of the portfolio each year, within a 5% ceiling and a 2.5% floor on last year’s spending after inflation.
- Daga, A., Clarke, A., Pakula, D. C. & Bupp, R. (2021). “Sustainable spending rates in turbulent markets.” Vanguard Research Note, March 2021. PDF. The same ceiling and floor rule.
The withdrawal scenarios use made-up, deterministic return paths built from the assumptions you enter: one steady return, and paths where a few years one typical swing below the average come first (or last), followed by the same number of years above it. The average is the same, so differences come only from the order of returns. These paths are not historical returns, not a forecast and not a probability.
Limits of this research: both studies use US market data and mostly 30-year horizons, and ignore fees and taxes. Results for other countries, longer retirements or a different future may be worse. That is why our tools let you choose a more cautious rate.
Official figures per country
Country pages under /numbers/ use only primary sources: the government body or regulator that publishes the figure (for example SSA and IRS in the US, gov.uk and HMRC in the UK). Each figure shows:
- the official source with a link,
- the date we checked it,
- a changelog when it changes.
Figures that are announced but not yet official are labelled as such, or not shown.
Quality checks
- Calculator formulas have automated unit tests that run before every release.
- Every official figure shows the date of its source and the date we last checked it.
- When we correct a figure or formula, we note the change and its date on the page concerned.
See also: editorial policy, disclaimer, affiliate disclosure.
Last updated: 2026-10-17